เทคนิคในการทำข้อสอบ IELTS writing
สมาชิกเลขที่119186 | 31 ก.ค. 55
10.4K views
การเขียนอธิบายกราฟเส้น
เนื้อหา
ในข้อสอบ IELTS Writing Task 1 เราไม่จำเป็นต้องแบ่งแยกย่อหน้า เพราะเป็นข้อเขียนที่สั้นมากๆ แต่บ่อยครั้งที่ผู้สอบพยายามแบ่งเป็นย่อหน้าย่อยๆ จนทำให้ข้อความที่มีอยู่ไม่กี่ประโยคดูสะเปะสะปะไม่เหมือนย่อหน้าเลยสักนิด รูปแบบย่อหน้าปกติที่ยอมรับได้ก็คือ เกริ่นนำ เคาะเว้นหนึ่งบรรทัด และหนึ่งย่อหน้าเนื้อหา ส่วนบทสรุปนั้นไม่จำเป็นต้องมีก็ได้
หลังจากที่กำหนดแผนคร่าวๆ ด้วยการวงกลมส่วนที่สำคัญๆ ในกราฟแล้ว เรายังควรเลือก Tense ที่เหมาะสม (ดูรายละเอียดเพิ่มเติมที่เรื่องThe IELTS Academic Writing Task (part 2) Grammatical Range and Accuracy)
จากนั้นให้ ตัดสินใจ ว่าเราจะแบ่งข้อมูลไปในทิศทางใด แบ่งตามวันที่ หรือตามหัวข้อ ส่วนจะเป็นแบบไหนขึ้นอยู่กับโจทย์ที่ให้มา
โดย กราฟเส้น นั้นจะมีลักษณะเป็นเส้น (จากด้านหนึ่ง ถึงด้านหนึ่งในเส้นเดียวกัน) ดังนั้นหากเป็นช่วงเวลาจะแทนค่าด้วยแกนแนวนอน (อยู่ด้านล่าง) ซึ่งเราสามารถแบ่งข้อมูลตามเวลาได้
ตัวอย่าง

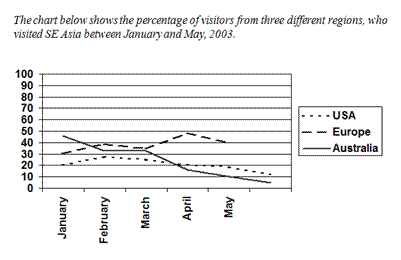
เราควรตามดูข้อมูลในแต่ละเส้น (USA, Europe และAustralia) ตั้งแต่เดือนมกราคม ถึง พฤษภาคม พยายามอย่าเขียนความเคลื่อนไหวของแต่ละภูมิภาคเรียงตามเดือน เพราะผลที่จะได้จะซ้ำกันมากๆ ซ้ำทั้งชื่อภูมิภาค และเดือน
วิธีเขียนที่ไม่เวิร์ก (แนวตั้ง)
In January the quantity for the USA was at 20%, for Europe at 30% and for Australia at around 45%. Next, in February it increased to just under 30% for the USA, it rose to 40% for Europe and for Australia there was a sizeable drop to approximately 32%...and so on
วิธีเขียนที่ดี (แนวนอน)
The USA started at 20% in January before it increased to just under 30% in February, this fell slightly in March and reached only 20% in April before dropping to its lowest point of 10% at the end of May.
จากตัวอย่างการเขียนที่ดี คำว่า Australia ถูกอ้างอิงเพียงครั้งเดียว และหลังจากนั้นก็ถูกแทนที่ด้วย ‘it’ ซึ่งแสดงให้เห็นถึงความต่อเนื่องและเป็นธรรมชาติ
จำไว้ว่า ใน Task 1 เรากำลังอธิบายกราฟที่เห็น เราไม่ได้กำลังวิเคราะห์ข้อมูลหรือให้เหตุปัจจัยว่าทำไมเส้นกราฟถึงเป็นเช่นนั้น (ไม่แสดงความคิดเห็น) สิ่งที่สำคัญที่สุดคือการเปรียบเทียบข้อมูลสถิติที่ตัวแปรแต่ละตัวมีความเชื่อมโยงกัน
นอกจากนี้ เราควรใช้คำประเภท expression เช่น
To begin with a first point,....
เพื่อดึงความสนใจของผู้อ่านให้ติดตาม และควรใช้อย่างหลากหลาย อาทิ
Next, following this, furthermore, in addition, finally, lastly...
คำพวกนี้จะช่วยให้ข้อเขียนของเราเป็นไปอย่างมีระบบระเบียบ น่าอ่านเพราะไม่มีคำซ้ำๆ ให้เห็นอีกด้วย
ตัวอย่างคำตอบที่ดี
The line-graph illustrates the quantity of visitors in SE Asia in 2003from January to the end of May, divided by the USA, Europe and Australia and measured in percentages. Overall, we can see that the quantity for both the USA and Australia decreases over this period, whereas that for Europe increases.
To begin with a first point, the amount of visitors from the USA started at 20% in January before it increased to just under 30% in February, this fell slightly in March and reached only 20% in April before dropping to its lowest point of 10% at the end of May,10% less than at the start of the year. Following this, Australia was about 25% greater than the USA at 45% at the start of the year; this fell to a little over 32% over the next two months before reaching a trough of only 5% in April. Finally, Europe began at 30% , gradually grew to 40% in February before hitting a peak of 50% in April, it then fell 10% to finish at 40% in May; 30% and 35% less than the USA and Australia respectively.
ข้อมูลดีๆจาก Jeremy Hanlan - British Council

